


What is Microsoft Power BI
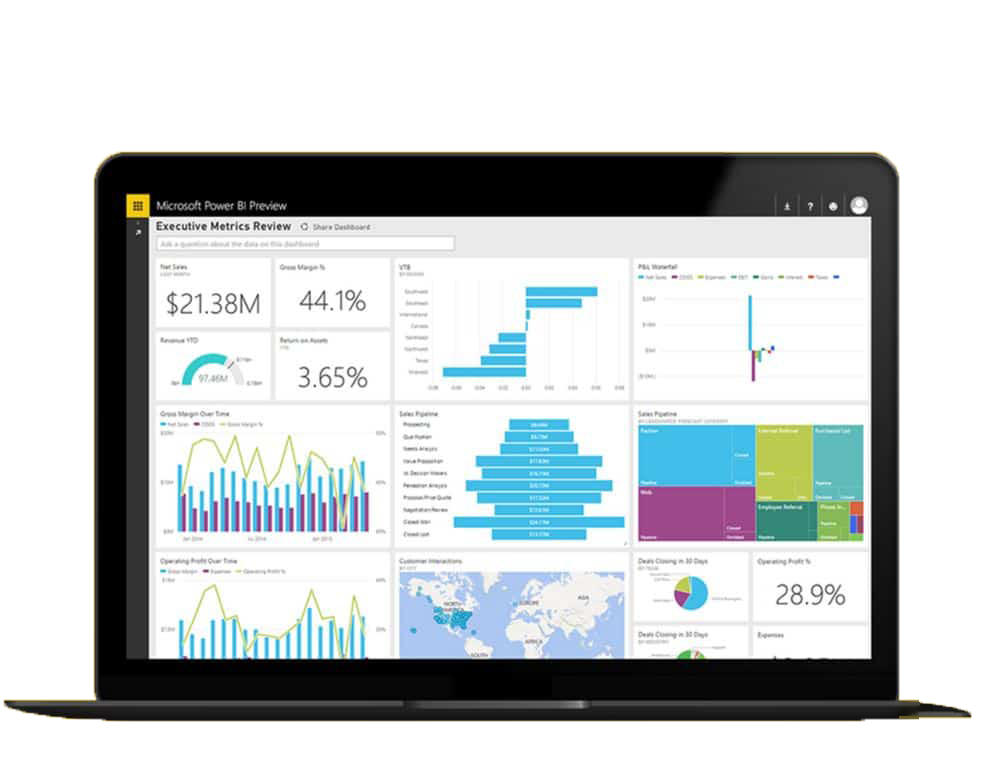
Microsoft Power BI is a self-service business intelligence (BI) solution integrated with Excel, Office 365, and Dynamics 365. It allows you to connect to and visualize any data and seamlessly infuse the visuals into the apps your teams use every day.
Microsoft Power BI includes an intuitive and user-friendly interface that allows you to transform, shape and merge your data into compelling and interactive reports. Take advantage of drill-down capabilities to dive even further into your data to reveal even more insights.
Our Power Platform expertise is unparalleled, meaning we can deliver business value much faster than other partners. Reach out to our Power BI team to help your organization turn data into meaningful insights and maximize the value of your technology investments.
What is Microsoft Power BI
Microsoft Power BI is a self-service business intelligence (BI) solution integrated with Excel, Office 365, and Dynamics 365. It allows you to connect to and visualize any data and seamlessly infuse the visuals into the apps your teams use every day.
Microsoft Power BI includes an intuitive and user-friendly interface that allows you to transform, shape and merge your data into compelling and interactive reports. Take advantage of drill-down capabilities to dive even further into your data to reveal even more insights.
Our Power Platform expertise is unparalleled, meaning we can deliver business value much faster than other partners. Reach out to our Power BI team to help your organization turn data into meaningful insights and maximize the value of your technology investments.
Copilot in Microsoft Power BI
Empowering Developers and Creators
Copilot for Power BI is an AI-powered assistant designed to enhance the data analysis and report creation experience with automated insights, natural language queries, report creation assistance and more.
Our Power Platform expertise is unparalleled, meaning we can deliver business value much faster than other partners. Reach out to our Power BI team to help your organization turn data into meaningful insights and maximize the value of your technology investments.
Explore All Microsoft POWER BI Options for Your Business
Our Team is Built
on Experience and Driven by Results
What Microsoft Power BI Can Do for You
Data-driven Decision Making
Empower your team to make informed decisions with real-time data visualizations and comprehensive analytics.

Enhanced Collaboration
Improve teamwork by sharing interactive reports and dashboards, ensuring everyone is on the same page.
Improved Efficiency
Streamline your data analysis process with automated data integration and advanced analytics features.

Greater Insights
Uncover hidden trends and patterns in your data, enabling you to predict future outcomes and make proactive decisions.
Increased Productivity
Save time and increase productivity by consolidating data from seemingly disparate sources.

Reduced Costs
Reduce the cost, complexity, and security risks of multiple solutions with an analytics platform that scales from individual users to the entire organization.
What Microsoft Power BI Can Do for You
Data-driven Decision Making
Empower your team to make informed decisions with real-time data visualizations and comprehensive analytics.
Enhanced Collaboration
Improve teamwork by sharing interactive reports and dashboards, ensuring everyone is on the same page.
Improved Efficiency
Streamline your data analysis process with automated data integration and advanced analytics features.
Greater Insights
Uncover hidden trends and patterns in your data, enabling you to predict future outcomes and make proactive decisions.
Increased Productivity
Save time and increase productivity by consolidating data from seemingly disparate sources.
Reduced Costs
Reduce the cost, complexity, and security risks of multiple solutions with an analytics platform that scales from individual users to the entire organization.
HOW TECHNOLOGY
CONCIERGES HELP YOU

Process Optimization
A Technology CONCIERGE can analyze a company’s existing processes and recommend software solutions that streamline workflows, reduce manual tasks, and eliminate inefficiencies. By implementing the right tools, businesses can improve productivity and reduce operational costs.

Tailored Technology Solutions
CONCIERGES provide customized software recommendations that fit the unique needs and goals of the business. Whether it's automating specific tasks, improving collaboration, or enhancing data management, they ensure the technology aligns with the company’s objectives.

Scalability and Future-Proofing
Our CONCIERGES help future-proof the business by selecting software solutions that are scalable and adaptable as the business grows. This prevents the need for constant overhauls or costly upgrades, ensuring the business can easily expand its operations without disruption.

HOW TECHNOLOGY
CONCIERGES HELP YOU
Process Optimization
A Technology CONCIERGE can analyze a company’s existing processes and recommend software solutions that streamline workflows, reduce manual tasks, and eliminate inefficiencies. By implementing the right tools, businesses can improve productivity and reduce operational costs.
Tailored Technology Solutions
CONCIERGES provide customized software recommendations that fit the unique needs and goals of the business. Whether it's automating specific tasks, improving collaboration, or enhancing data management, they ensure the technology aligns with the company’s objectives.
Scalability and Future-Proofing
Our CONCIERGES help future-proof the business by selecting software solutions that are scalable and adaptable as the business grows. This prevents the need for constant overhauls or costly upgrades, ensuring the business can easily expand its operations without disruption.
