
Blog
PSA Pipeline Forecasting: Setup & Fixes
nbetters · · 5 min read
Professional Services Pipeline Forecasting: Technical Implementation and Troubleshooting Guide | Betters Agency Professional Services Pipeline Forecasting: Technical Implementation and Troubleshooting Guide For professional services leaders, forecasting is a high-stakes exercise in visibility.…
Professional Services Pipeline Forecasting: Technical Implementation and Troubleshooting Guide
For professional services leaders, forecasting is a high-stakes exercise in visibility. Revenue depends on people, demand fluctuates, and disconnected spreadsheets create significant risk for inaccurate planning. This guide provides a technical, source-backed framework to implement a unified forecasting system, diagnose common failures, and ensure operational reliability.
The Core Problem: Disconnected Data and Its Symptoms
Professional services forecasting is uniquely complex because revenue is tied directly to billable capacity and project delivery velocity. A primary symptom of a failing system is the reliance on disconnected spreadsheets for pipeline, resource, and financial data. This fragmentation increases the risk of inaccurate planning and obscures visibility into future demand, resource capacity, and backlog health. Common operational failures include:
- Limited visibility into pipeline impact on future revenue.
- Misalignment between sales forecasts and delivery capacity.
- Inaccurate projections driven by outdated or incomplete data.
- Last-minute hiring, consultant overutilization, or underutilized staff.
For a firm in the Minneapolis metro, these symptoms manifest as missed project starts due to skill shortages or unexpected cash flow gaps, problems that a unified operating model can solve.
Prerequisites: Laying the Architectural Foundation
Before writing a line of code, establish foundational governance and data architecture. A mature forecasting model requires a clean services data architecture with standardized semantic definitions for core entities: project, client, contract, resource, role, rate card, and revenue recognition rule. Without this consistency, forecast logic fragments across business units.
Governance is critical. Define clear ownership: sales must own pipeline probability and timing, delivery must own effort and staffing confidence, and finance must own revenue recognition logic. Furthermore, this implementation should be planned as part of a broader forecast-to-plan business process within your ERP strategy, as design decisions here impact downstream integrations and data migration.
Recommended Architecture and Integration Points
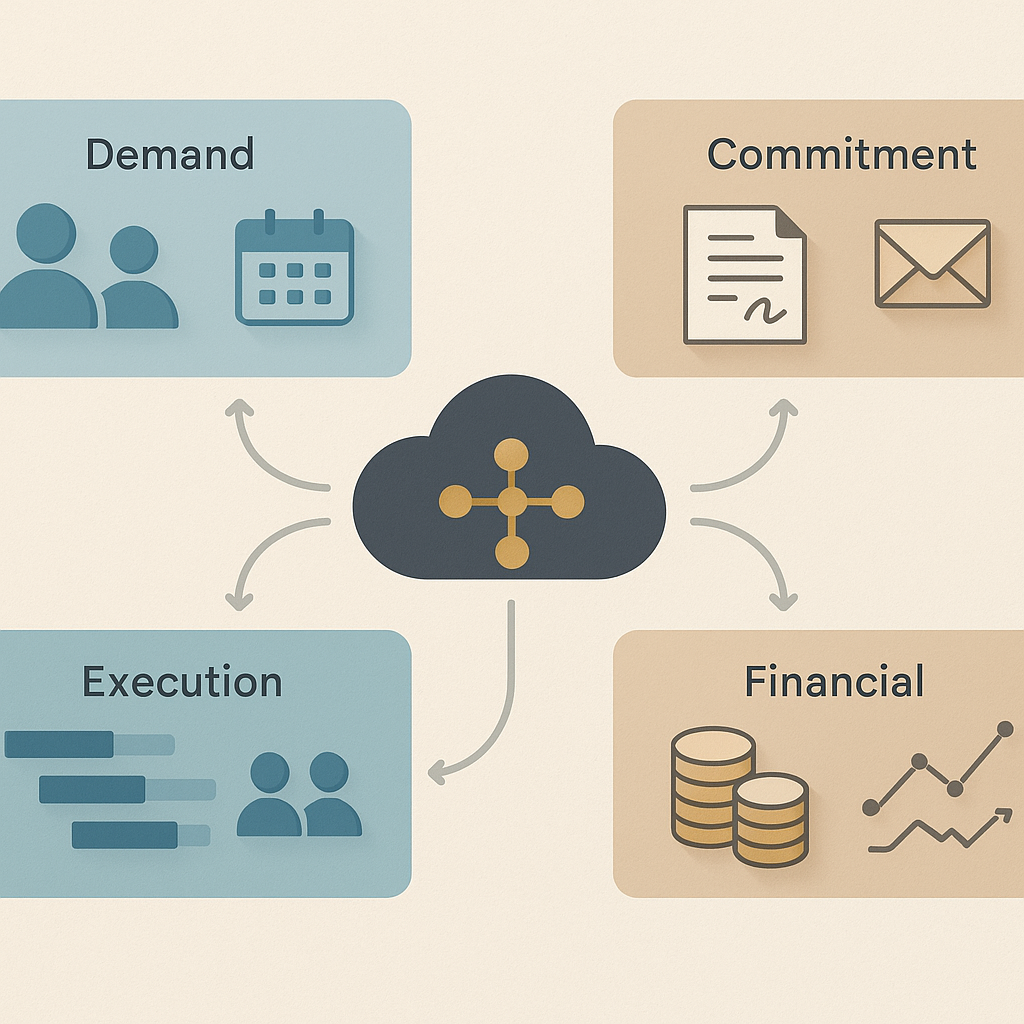
A unified model connects disparate systems into a single forecasting framework. Cloud ERP platforms like Microsoft Dynamics 365 Business Central are effective as they centralize transactional data and expose APIs for planning and analytics. The architecture should integrate four logical layers:
- Demand Layer: CRM opportunities with probability, close dates, and estimated effort.
- Commitment Layer: Signed contracts, statements of work, and billing terms.
- Execution Layer: Resource assignments, planned/actual hours, and milestone completion.
- Financial Layer: Revenue recognition schedules, invoices, work-in-progress (WIP), and project margin.
This integration allows your organization to distinguish between probable demand, contracted work, delivered work, and collected cash, with each stage supporting different executive decisions. For a professional services firm in Saint Paul, this means a project manager can see how a delayed contract signature in the Commitment Layer impacts scheduled work in the Execution Layer and the financial forecast.
Implementation Steps: Moving Forecasting to the Core
Implementation should move forecasting into the core of financial processes, not treat it as a side exercise. Using a platform like Business Central, forecasts are built using historical transaction data and statistical models grounded in actual performance, which then flow into financial, staffing, and operational planning.
A practical, phased implementation approach:
- Phase 1: Data Consolidation. Map and migrate core entity definitions (project, resource, rate card) into a central ERP or PSA system. Establish master data governance.
- Phase 2: Integration Enablement. Configure APIs or integration middleware to connect your CRM (Demand Layer) and project management tools (Execution Layer) to the central system.
- Phase 3: Forecast Logic Configuration. Within your central system, configure revenue recognition rules, utilization calculations, and backlog classification logic based on contract type and delivery model.
- Phase 4: Reporting and Analytics Deployment. Build Power BI reports or embedded dashboards that pull from the unified data model to provide visual insights for leadership and operational teams.
Validation and Ongoing Governance
Validation requires comparing forecasted revenue against billing plans, WIP balances, and historical conversion patterns. For ongoing validation, tools like Power BI can build sales forecasting reports that provide leadership and sales managers with visual insights into pipeline performance.
Establish a regular operational cadence: weekly reviews for operational staffing adjustments, monthly alignment for financial close and guidance, and quarterly deep dives for strategic scenario planning. This disciplined rhythm is essential for Twin Cities firms managing complex, multi-phase client engagements.
Common Failure Modes and Troubleshooting
Even well-architected systems fail without vigilance. Here are critical failure modes and their remedies:
- Failure Mode: Data Fragmentation. Symptoms include conflicting forecast numbers from different departments. Remedy: Enforce semantic consistency for core entities and centralize data stewardship. Audit and retire rogue spreadsheets.
- Failure Mode: Skill Bottleneck Blindness. Healthy overall utilization masks a shortage of specialists. Remedy: Model utilization by skill, role, and practice area, not just aggregate headcount. Compare future backlog demand against skill-specific capacity.
- Failure Mode: Poor Backlog Classification. Treating all contracted value as executable backlog misrepresents revenue quality. Remedy: Classify backlog into funded, scheduled, staffed, and at-risk segments to identify real constraints.
- Failure Mode: Weak Data Governance. Forecast accuracy decays without ownership for pipeline assumptions and schedule updates. Remedy: Implement validation rules, approval workflows, and audit trails. Hold process owners accountable for data timeliness and quality.
Rollback Strategy and Operational Checklist
If a new forecasting process or integration causes systemic issues, a rollback strategy is essential. This involves reverting to the last known-good, consolidated data export from your ERP system while diagnosing integration or data quality failures in the automated pipeline. Maintain a weekly export of critical forecast inputs (pipeline values, resource assignments, project schedules) as a contingency.
Pre-Launch Operational Checklist:
- [ ] Core entity definitions (project, resource, rate card) are standardized and documented.
- [ ] Data ownership (Sales/Delivery/Finance) is formally assigned and communicated.
- [ ] Key integrations (CRM to ERP, PSA to Finance) are tested with real data.
- [ ] Forecast logic (revenue recognition, utilization) is validated against historical projects.
- [ ] Reporting dashboards are provisioned for leadership and operational teams.
- [ ] A rollback plan and communication procedure are in place.
Conclusion: From Spreadsheet Risk to Strategic Foresight
Implementing a unified pipeline forecasting system transforms a reactive, risk-laden process into a source of strategic foresight. By establishing a clean data architecture, integrating key operational layers, and enforcing disciplined governance, professional services firms can replace guesswork with confidence. For leaders across Minnesota, from the tech corridors of Minneapolis to the corporate centers of St. Paul, this technical foundation is critical for navigating fluctuating demand and maximizing the value of your most important asset: your people.
Ready to move beyond spreadsheet forecasting and build a reliable, integrated pipeline model? Contact Betters Agency for a technical consultation on implementing a unified forecasting system.